whoami
- じょんすみす
- クラスメソッド株式会社
- データインテグレーション(DI)部 ML推進チームリーダー

やってること
- Hadoop/Sparkおじさん
- 機械学習の人
- Alteryxの人
本日の内容
- Jupyter Notebookの基本的な機能をサラッと紹介
- たぶん今日の内容だけで最低限使えるけど興味を持って詳しく知りたくなったら調べてね☆彡
インタラクティブな環境とは
- 通常のプログラム
- 処理全体を記述したスクリプトを一括で実行する
- Pythonの場合、.pyファイルを指定してpythonコマンドを実行
- 一連の流れを一通り記述したのち全体を実行するので細かい単位での処理内容の確認が難しい
- ファイルの内容に変更がなければ常に同じ結果を得られる
- インタラクティブな環境
- いわゆるREPL
- Pythonの場合、.pyを指定せずにpythonコマンドを実行
- 1行記述して実行を繰り返していく
- 細かい単位で処理結果を確認できる
- 記述した内容を保存しておけない

Jupyter Notebookとインタラクティブな環境
Jupyter Notebookを使えばインタラクティブにスクリプトを実行しながら処理内容も保存しておける
In [1]:
print('Hello')
Hello
処理は複数行・複数命令を記述可能
In [2]:
items = ['ピーター', 'フロプシー', 'モプシー', 'カトンテール', 'ベンジャミン']

for index, item in enumerate(items) :
    print('{}: {}'.format(index, item))


# セル内の一番最後の処理の戻り値は変数で受け取らなければそのまま出力される
result = 'Done'
result
0: ピーター
1: フロプシー
2: モプシー
3: カトンテール
4: ベンジャミン
Out[2]:
'Done'
関数などの定義のみのセルも作成可能
In [3]:
def rabbit_function() :
    pass

class rabbit_class:
    def rabiit_method() :
        pass
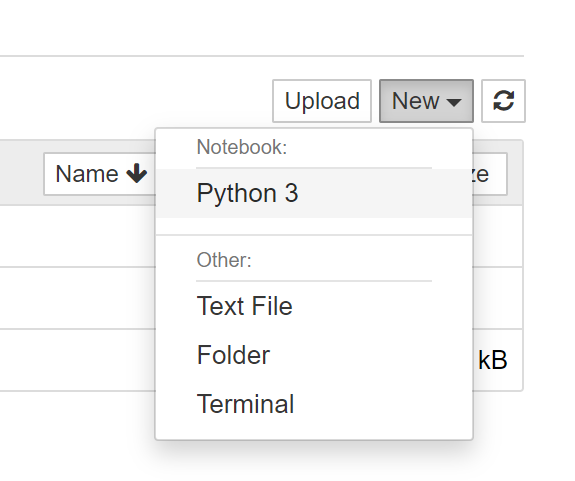
- ブラウザの新規タブで立ち上がり以下のような画面が表示される(localhost:8888を直接入力してもok)

- 右上の[new] > [Python3]を選択することによって新規Notebookを作成


プログラムの処理単位とセル
- セルと言われる単位でプログラムを実行する
- セル内に処理を記述して実行(Shift-EnterまたはCtrl-Enter)
- セルの追加・削除は自由に行える
- コマンドモードと編集モード
- Escキーを押してコマンドモードへ移行
- コマンドモードではカーソルキー上下でセル間の移動
aで現在セルの上、bで下に新しいセルを追加ddでセルの削除Enterで現在のセルに対して変数モードに移行
- Escキーを押してコマンドモードへ移行
- その他のショートカット
hで一覧表示

Notebookの保存
- Notebookはファイルとして保存しておける
- .ipynbファイル
- 中身はJSON
- 実行結果なども含めて保存されるので次回開いたときにその情報が残ってる
Jupyter Notebookのマジックコマンド
Jupyter Notebookはマジックコマンドをというものを利用することで様々なことが行える
マジックコメントを利用するには先頭に%を付けて実行する
処理時間の計測
処置時間を計測する%time
In [5]:
%time sum(range(100000))
Wall time: 2.99 ms
Out[5]:
4999950000
%timeitを使うことで複数回計測して統計情報も出す
In [6]:
%timeit sum(range(10000))
172 µs ± 3.7 µs per loop (mean ± std. dev. of 7 runs, 1000 loops each)
複数行にわたる処理の時間を計測する場合は%%を使う
In [7]:
%%time
import random

items = [random.randint(1, 10) for _ in range(10000)]
sum(items)
Wall time: 18.9 ms
過去の実行履歴を確認する
In [8]:
%history
print('Hello')
items = ['ピーター', 'フロプシー', 'モプシー', 'カトンテール', 'ベンジャミン']

for index, item in enumerate(items) :
    print('{}: {}'.format(index, item))


# セル内の一番最後の処理の戻り値は変数で受け取らなければそのまま出力される
result = 'Done'
result
def rabbit_function() :
    pass

class rabbit_class:
    def rabiit_method() :
        pass
# デモ用のセル
%time sum(range(100000))
%timeit sum(range(10000))
%%time
import random

items = [random.randint(1, 10) for _ in range(10000)]
sum(items)
%history
変数の確認
In [9]:
%who
index item items rabbit_class rabbit_function random result
In [10]:
%whos
Variable          Type        Data/Info
---------------------------------------
index             int         4
item              str         ベンジャミン
items             list        n=10000
rabbit_class      type        <class '__main__.rabbit_class'>
rabbit_function   function    <function rabbit_function at 0x0000024A87E0AA60>
random            module      <module 'random' from 'C:<...>ython37\\lib\\random.py'>
result            str         Done
コマンドの実行
In [11]:
%%bash
ls
PyCon mini Sapporo 2019.ipynb
img
pycon_sapporo2019_env
In [12]:
!pip list
Package            Version
------------------ -------
attrs              19.1.0
backcall           0.1.0
bleach             3.1.0
colorama           0.4.1
cycler             0.10.0
decorator          4.4.0
defusedxml         0.6.0
entrypoints        0.3
ipykernel          5.1.0
ipython            7.5.0
ipython-genutils   0.2.0
ipywidgets         7.4.2
jedi               0.13.3
Jinja2             2.10.1
jsonschema         3.0.1
jupyter            1.0.0
jupyter-client     5.2.4
jupyter-console    6.0.0
jupyter-core       4.4.0
jupyterlab         0.35.6
jupyterlab-server  0.2.0
kiwisolver         1.1.0
MarkupSafe         1.1.1
matplotlib         3.0.3
mistune            0.8.4
nbconvert          5.5.0
nbformat           4.4.0
notebook           5.7.8
numpy              1.16.3
pandas             0.24.2
pandocfilters      1.4.2
parso              0.4.0
pickleshare        0.7.5
pip                19.0.3
prometheus-client  0.6.0
prompt-toolkit     2.0.9
Pygments           2.4.0
pyparsing          2.4.0
pyrsistent         0.15.1
python-dateutil    2.8.0
pytz               2019.1
pywinpty           0.5.5
pyzmq              18.0.1
qtconsole          4.4.4
scikit-learn       0.20.3
scipy              1.2.1
Send2Trash         1.5.0
setuptools         40.8.0
six                1.12.0
terminado          0.8.2
testpath           0.4.2
tornado            6.0.2
traitlets          4.3.2
wcwidth            0.1.7
webencodings       0.5.1
widgetsnbextension 3.4.2
You are using pip version 19.0.3, however version 19.1.1 is available.
You should consider upgrading via the 'python -m pip install --upgrade pip' command.
利用可能なマジックコマンド一覧
In [13]:
%lsmagic
Out[13]:
Available line magics:
%alias  %alias_magic  %autoawait  %autocall  %automagic  %autosave  %bookmark  %cd  %clear  %cls  %colors  %conda  %config  %connect_info  %copy  %ddir  %debug  %dhist  %dirs  %doctest_mode  %echo  %ed  %edit  %env  %gui  %hist  %history  %killbgscripts  %ldir  %less  %load  %load_ext  %loadpy  %logoff  %logon  %logstart  %logstate  %logstop  %ls  %lsmagic  %macro  %magic  %matplotlib  %mkdir  %more  %notebook  %page  %pastebin  %pdb  %pdef  %pdoc  %pfile  %pinfo  %pinfo2  %pip  %popd  %pprint  %precision  %prun  %psearch  %psource  %pushd  %pwd  %pycat  %pylab  %qtconsole  %quickref  %recall  %rehashx  %reload_ext  %ren  %rep  %rerun  %reset  %reset_selective  %rmdir  %run  %save  %sc  %set_env  %store  %sx  %system  %tb  %time  %timeit  %unalias  %unload_ext  %who  %who_ls  %whos  %xdel  %xmode

Available cell magics:
%%!  %%HTML  %%SVG  %%bash  %%capture  %%cmd  %%debug  %%file  %%html  %%javascript  %%js  %%latex  %%markdown  %%perl  %%prun  %%pypy  %%python  %%python2  %%python3  %%ruby  %%script  %%sh  %%svg  %%sx  %%system  %%time  %%timeit  %%writefile

Automagic is ON, % prefix IS NOT needed for line magics.
CodeセルとMarkdownセル
- NotebookのセルはPythonコードのみでなく、テキストやMarkdownの記述も可能
- これによってコードとして再現可能なドキュメント化や実行可能な手順書としての利用することも可能
セルをMarkdownに変更
- コマンドモードで
mを押すことで現在のセルをMarkdownに変更
ここにMarkdownでドキュメントを記載します。
セルをCodeに変更
- デフォルト状態ではCodeになっている
- MarkdownのセルをCodeに戻したい場合は
yを押す
In [14]:
# ここにコードを記述して実行可能
print('Hello')
Hello
データ分析環境としてのJupyter Notebook
- Juypter Notebookはデータ分析に利用されるPandasやMatplotlibとの親和性が高い
PandasのDataFrame表示
- データ分析でよく使われるライブラリ
- DataFrame(RDBのテーブルような形式)でデータをまとめて持っておける
- RDBのSQLに対応するような様々な操作を機能として提供している
In [15]:
import pandas as pd
from sklearn.datasets import load_iris

iris = load_iris()
In [16]:
# データは1件のデータが4つの観測値を持つ
# 1件のデータが長さ4の配列でさらにそれがデータ件数分の2次元配列になっている
iris['data'][:5]
Out[16]:
array([[5.1, 3.5, 1.4, 0.2],
       [4.9, 3. , 1.4, 0.2],
       [4.7, 3.2, 1.3, 0.2],
       [4.6, 3.1, 1.5, 0.2],
       [5. , 3.6, 1.4, 0.2]])
In [17]:
# 各観測値が何を計測した値なのかはfeature_names
iris['feature_names']
Out[17]:
['sepal length (cm)',
 'sepal width (cm)',
 'petal length (cm)',
 'petal width (cm)']
In [18]:
# このデータをDataFrameにする
df = pd.DataFrame(iris['data'], columns=map(lambda x : x[:-5].replace(' ', '_'), iris['feature_names']))
print(df.head())
   sepal_length  sepal_width  petal_length  petal_width
0           5.1          3.5           1.4          0.2
1           4.9          3.0           1.4          0.2
2           4.7          3.2           1.3          0.2
3           4.6          3.1           1.5          0.2
4           5.0          3.6           1.4          0.2
In [19]:
# テーブルに整形された表示
df.head()
Out[19]:
| sepal_length | sepal_width | petal_length | petal_width | |
|---|---|---|---|---|
| 0 | 5.1 | 3.5 | 1.4 | 0.2 |
| 1 | 4.9 | 3.0 | 1.4 | 0.2 |
| 2 | 4.7 | 3.2 | 1.3 | 0.2 |
| 3 | 4.6 | 3.1 | 1.5 | 0.2 |
| 4 | 5.0 | 3.6 | 1.4 | 0.2 |
Matplotlibのグラフをインライン表示
- グラフを生成するライブラリ
In [20]:
%matplotlib inline
In [21]:
df.plot.scatter(x='petal_length', y='petal_width')
Out[21]:
<matplotlib.axes._subplots.AxesSubplot at 0x24a917359b0>
Notebookの共有
- NotebookはGithubに上げるとRead Onlyでそのまま表示可能
- 実行番号や出力もそのまま含まれるの以下をやっておくといい
- 出力を含めない場合は Kernel > Restart & Clear Output
- 出力も含めて共有する場合は Kernel > Restart & Run All
- 共有前は一度 Kernel > Restart & Run All をして上から順に実行できるか確認しておくとよい
- Jupyter Notebookで作業中は前後のセルを行ったり来たりも多い
- 変数の定義場所などの関係で上からやると動かず同じ結果を再現できない場合がある
実際のNotebook例
その他機能について
- 本日紹介していないけど便利な機能
- 動的なグラフを描画
- Extensionで拡張
- Python以外の言語を動かすためのKernel導入
- この資料もJupyter Notebookで作成
まとめと注意点
- Jupyter Notebookの紹介
- 保存・再利用可能なインタラクティブなPython実行環境
- マジックコマンド・Markdownでドキュメント化といった便利機能
- データ分析環境としての活用
- Githubを使っての共有
- 注意点
- Notebookは試行錯誤しながらプログラムを記述するのでコードが汚くなりがち
- 例外などもその場で見て確認→修正となるのでハンドリングされてないことが多い
- .pyファイルとしてそのまま出力することも可能だが本番利用の歳は要注意
